The Stellarium
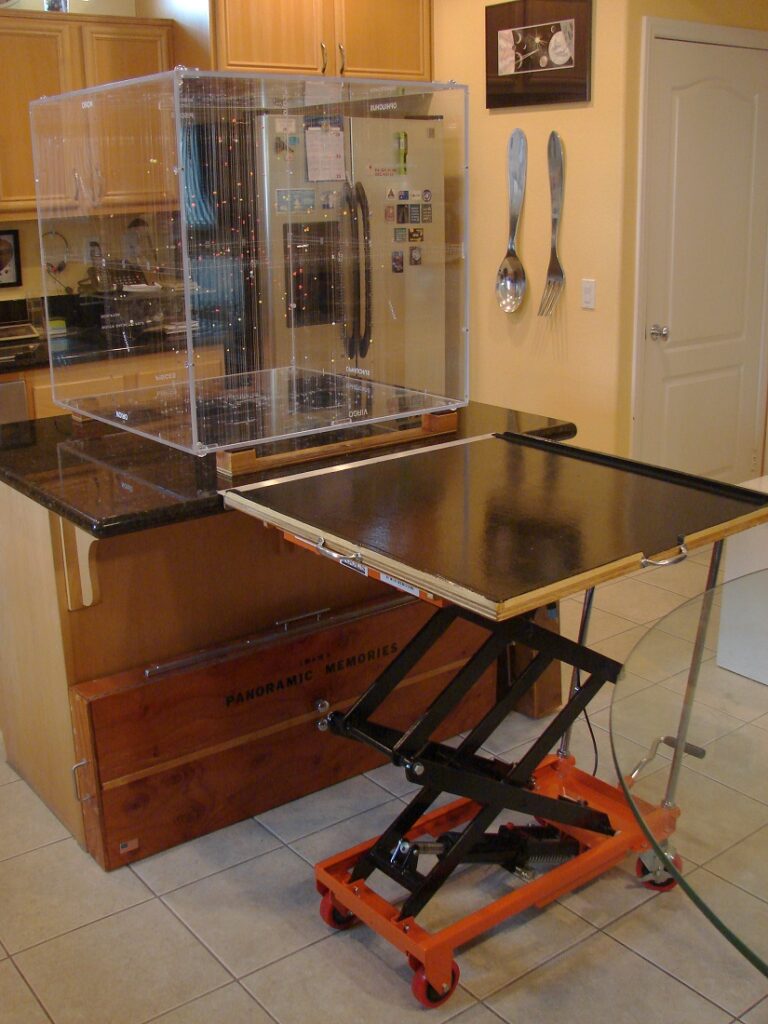
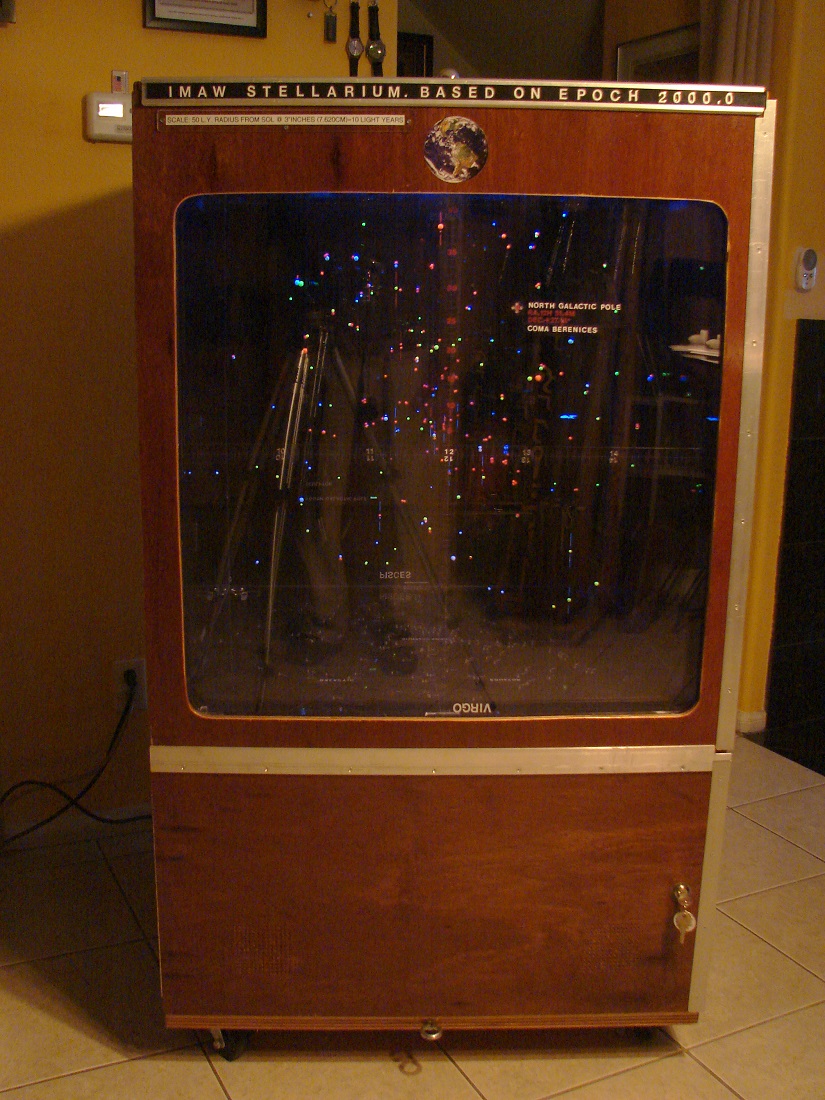
This is the Stellarium of IMAW.
It depicts the location, spectral classification, and presence of exoplanets for all stars within 50 Light Years of our Solar System.
Designed and built entirely by Mitchell A. Walker, it is the second version of this incredible visualization of our stellar neighborhood.
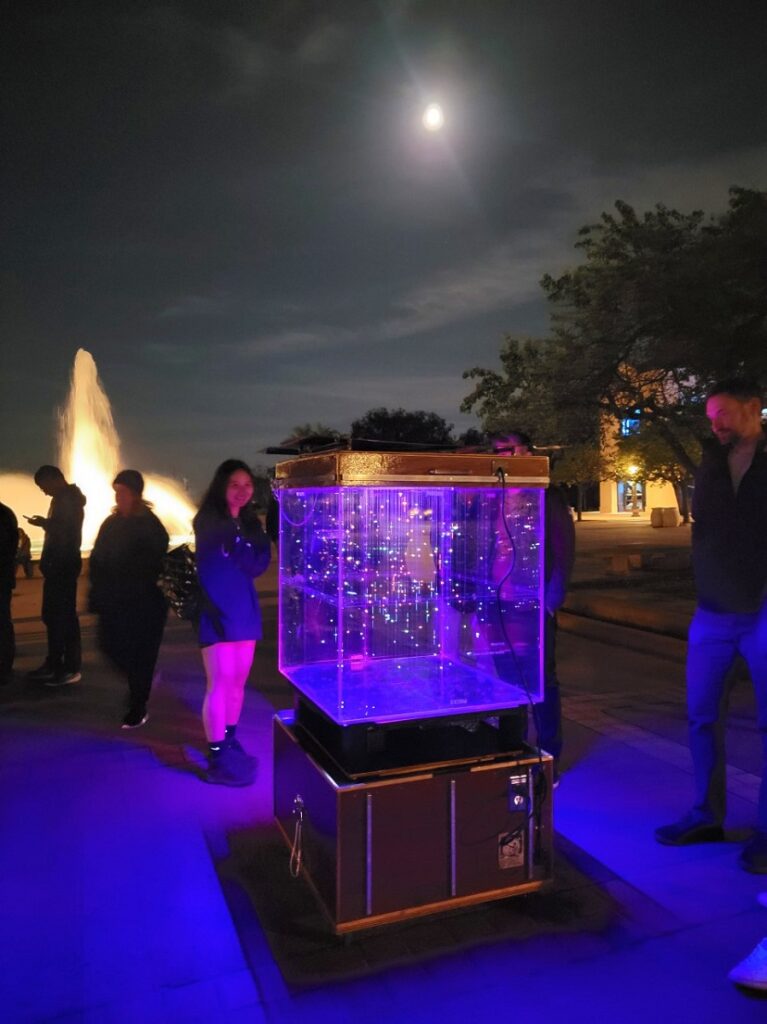
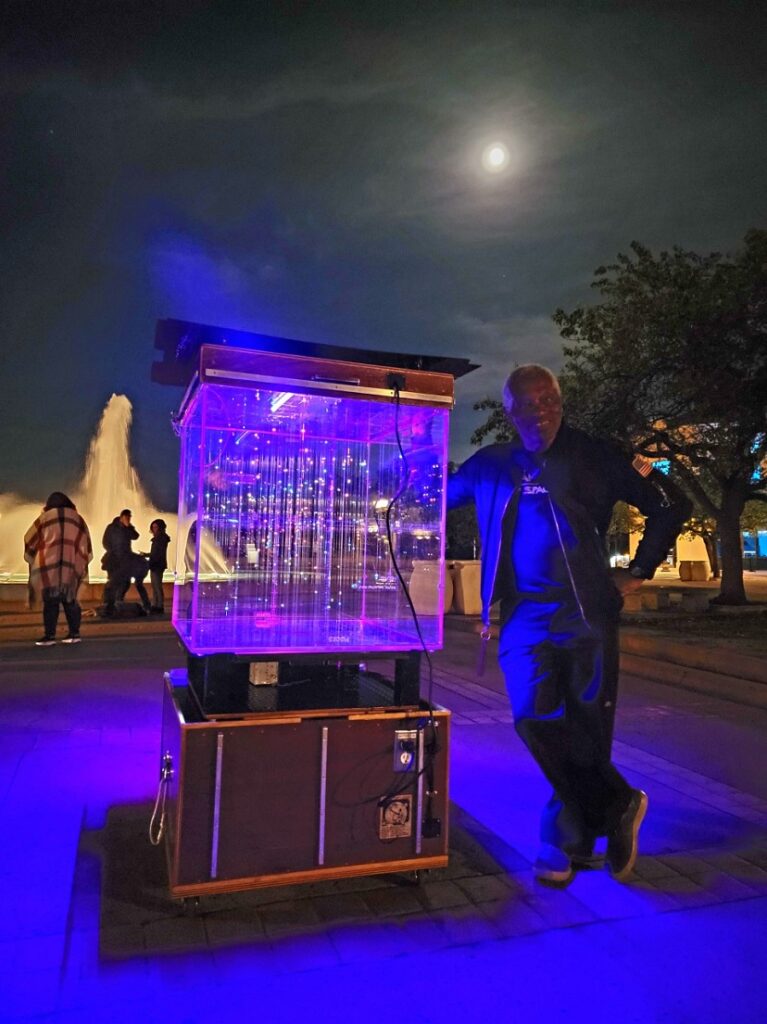
It is often displayed in public science venues. Weather permitting, I often bring the Stellarium to the Stars in the Park event on The Prado on the first Wednesday of each month outside the Reuben H. Fleet Science Center.
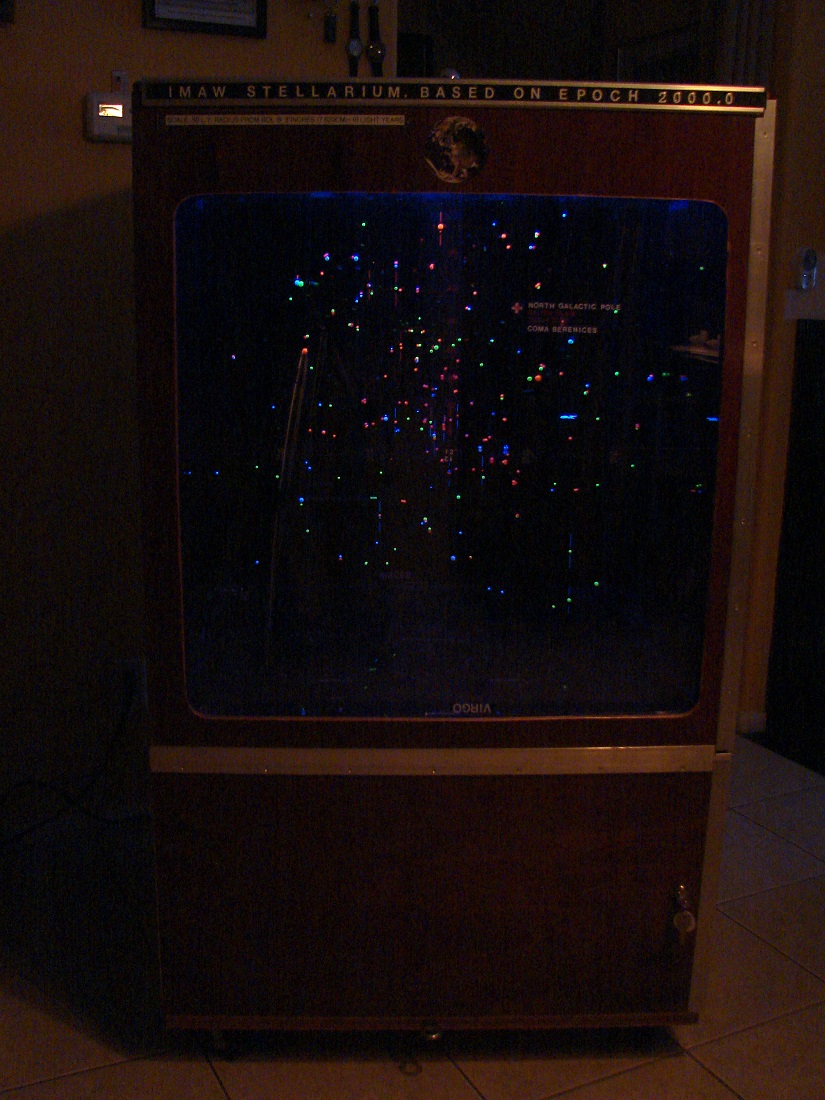
Illuminated by ultraviolet light, each star is colored according to it’s place in the Morgan Kenan system.
Wikipedia article of stellar classification.

Understanding the Stellarium

SP268E H-R Diagram of Star Colors and Temperature

SP268 Star Listing Chart Epoch 2000 Page 1

SP268A StarListing Chart Epoch 2000 Page 2

SP268B Star Listing Chart Epoch 2000 Page 3

SP268C Star Listing Chart Epoch 2000 Page 4

SP268D Star Listing Chart Epoch 2000 Page 5
Click to view gallery images

The Hertzsprung–Russell diagram (abbreviated as H–R diagram, HR diagram or HRD) is a scatter plot of stars showing the relationship between the stars’ absolute magnitudes or luminosities and their stellar classifications or effective temperatures.
The diagram was created independently in 1911 by Ejnar Hertzsprung and by Henry Norris Russell in 1913, and represented a major step towards an understanding of stellar evolution.

The Great Stellarium 30 inch square 3D star map Project had its first public debut at Balboa Park’s “Stars in the Park” on May 1st 2019.
I have exhibited this intriguing and interactive display at a number of places since then.
Come and see the stellar neighborhood at its proper location of 50 light years radius @ 3 inches to 10 light years in physical 3D lite up in black light.
I have exhibited this intriguing and interactive display at a number of places since then.
Come and see the stellar neighborhood at its proper location of 50 light years radius @ 3 inches to 10 light years in physical 3D lite up in black light.